Short answer: To check CPU temp, open the BIOS or UEFI setup for an idle reading. Live numbers per core? Install Core Temp, HWMonitor or AMD Ryzen Master. Task Manager shows no CPU temperature. Then we'd compare the highest reading under load with the maximum on the Intel or AMD spec page.
To check CPU temp on Windows, open the BIOS or UEFI setup for an idle reading, or install a free monitor such as Core Temp, HWMonitor or AMD Ryzen Master for live numbers. Task Manager won’t help. Then compare the reading with the maximum on your processor’s spec page.
| Method | What you see | Good for |
|---|---|---|
| BIOS or UEFI setup | One temperature, at idle | A quick look without installing anything |
| Core Temp | Each core, live, with lowest and highest values | Intel, AMD and VIA processors |
| HWMonitor | CPU plus voltages, fans, drives, GPU | The whole PC on one screen |
| AMD Ryzen Master | Per-core clocks, temperature, voltages, average and peak | Ryzen processors |
| Task Manager | CPU load and speed, no CPU temperature | Finding the app that heats the CPU |
How to check CPU temp in BIOS or UEFI
Nothing to download. The firmware reads the sensor itself.
- Settings, System, Recovery. On Windows 10: Update & Security, Recovery.
- Next to Advanced startup, press Restart now.
- Troubleshoot, Advanced options, UEFI Firmware Settings, Restart.
- Look for a monitor or health page in the firmware menus.
The page name depends on the board or PC maker. Hardware monitor, PC health, system status. Some laptops show nothing at all.
The catch: the processor is barely working in that screen. You get an idle figure, useful as a baseline, useless for gaming heat. We’d use it once to confirm the sensor works, then move to software.
Can’t reach firmware settings from Windows? Our guide on how to enter BIOS lists the startup keys by brand.
Why Task Manager shows no CPU temperature
Ctrl + Shift + Esc, Performance, CPU. Utilization, speed, processes, threads, uptime. No temperature line.
Some dedicated graphics cards do show a temperature on the GPU tab there. That’s the graphics chip. Different sensor, different limit.
Task Manager still earns its place. High temperature at idle? Sort the Processes tab by CPU and see who’s busy. AMD’s own troubleshooting article points at background apps that keep polling the processor, RGB tools among them.
Command-line tricks that promise a CPU temperature in PowerShell exist. On many PCs they return nothing or a board sensor, not the cores. We wouldn’t trust them for this.
Check CPU temperature with a monitoring tool
Live numbers, while you work or play. Three tools cover most PCs. Download each one only from its maker’s site, never from a mirror.
| Tool | Maker’s site | What the maker says it shows |
|---|---|---|
| Core Temp | alcpu.com | The temperature of each individual core, real time, Intel, AMD and VIA processors |
| HWMonitor | cpuid.com | Main health sensors: voltages, temperatures, powers, currents, fan speeds, clocks |
| AMD Ryzen Master | amd.com | Per-core clock rates, temperature and voltages, with average and peak readings |
Read every installer screen. Offers for extra software can sit between the Next buttons, and you’re free to untick them.
Core Temp, step by step:
- Download it from the Core Temp page on alcpu.com.
- Install and open it.
- Find your processor model at the top.
- Read one line per core: current, Min and Max.
The Min and Max columns keep counting while the window stays open. Leave it running through a game session and Max tells you the worst moment.
HWMonitor puts everything in one tree. CPU package, cores, fans, the drives. Handy when you suspect a fan rather than the processor.
Intel and AMD: what the processor makers say
Intel has a short support article on this. Each processor carries a digital thermal sensor on the die. Many third-party utilities read it. Typical ranges per model? Intel doesn’t publish them, since cooling and workload decide.
AMD ships its own tool for Ryzen. Ryzen Master shows per-core temperature, clocks and voltages, plus average and peak readings, and you can pick which metrics to watch.
So on a Ryzen desktop we’d start with Ryzen Master. On Intel, a third-party reader is the normal route, as Intel itself describes.
Reading the numbers: cores, package, Tj. Max
Several lines, all called temperature. Which one matters?
| Label | What it is | How to read it |
|---|---|---|
| Core #0, Core #1 … | Sensor reading for each core | Watch the hottest core, not the average |
| Package or CPU | Reading for the whole chip | A good single number for a quick check |
| Tj. Max | Maximum junction temperature of the model | The ceiling, not a target |
| Min and Max columns | Lowest and highest since the tool started | Max after a heavy session is the useful one |
Distance to Tj. Max matters more than any number taken from a forum. A chip rated for 95 degrees and sitting at 80 has room left.
Package and core values rarely match. The hottest core leads, the package line averages things out a bit. We’d judge by the hottest core and keep the package number as a quick reference for later checks.
What CPU temperature is too hot
Check your own model. Limits differ, and the makers list them.
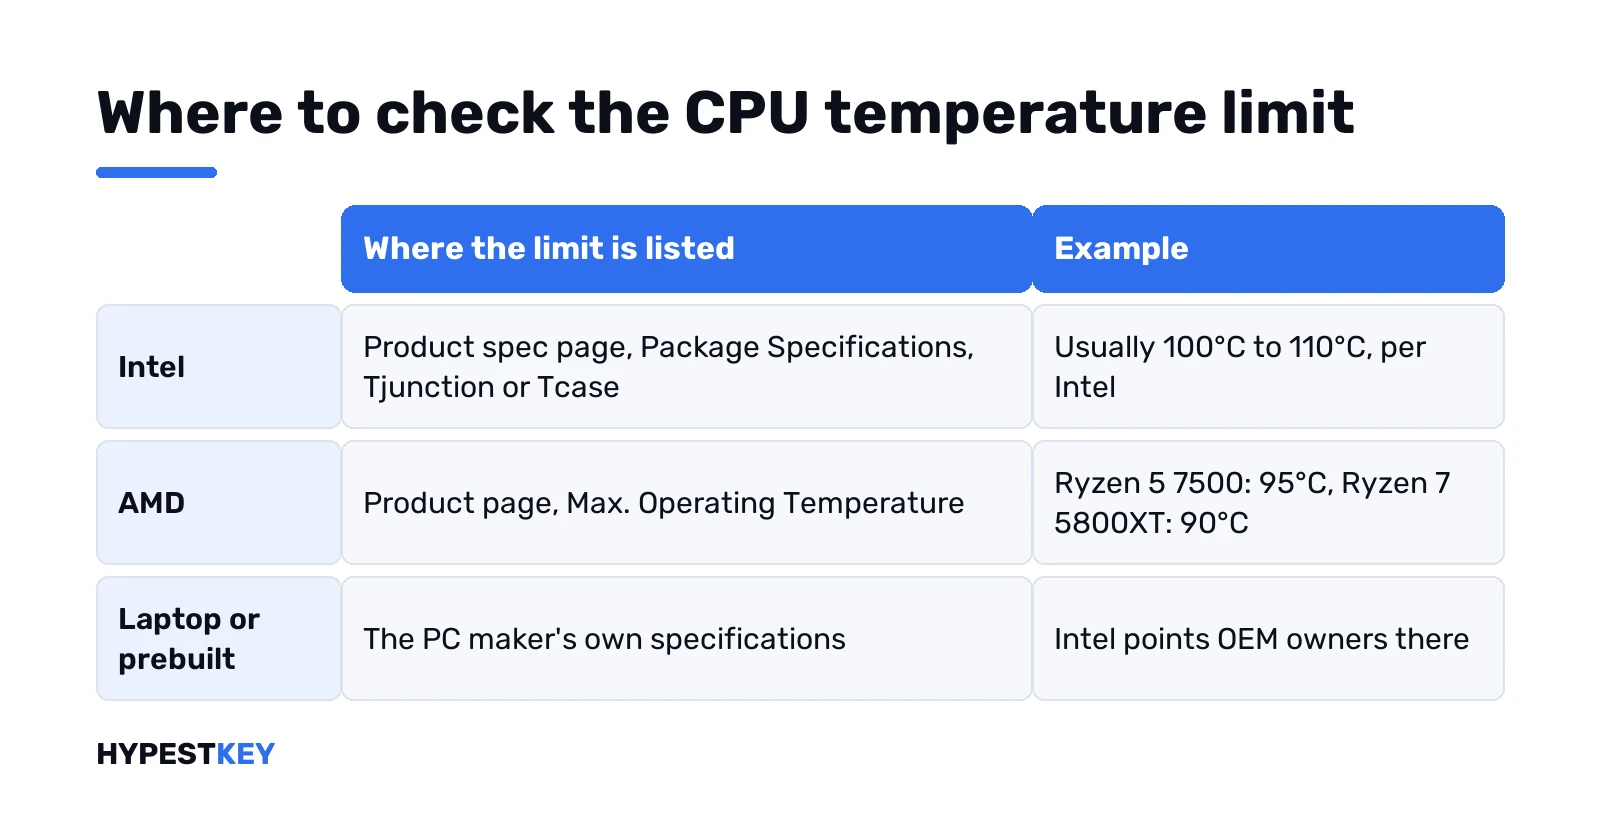
| Maker | Where the limit is listed | Examples |
|---|---|---|
| Intel | Product spec page, Package Specifications, Tjunction or Tcase | Usually between 100°C and 110°C, per Intel |
| AMD | Product page, Max. Operating Temperature | Ryzen 5 7500: 95°C. Ryzen 7 5800XT: 90°C |
| Laptop or prebuilt | The PC maker’s specifications | Intel points owners of OEM systems there |
Intel’s article on processor temperature adds one point people miss. Under turbo and long workloads, a chip can sit at or near its maximum, and that alone isn’t necessarily a concern. Temperature on its own doesn’t prove a cooling problem.
What does point to one? High readings at idle. Max values that jump within seconds of starting a game. Clocks falling while the temperature stays pinned. Those three together, and we’d open the case.
How to check CPU temp under load
Idle numbers say little. Heat shows up when every core works.
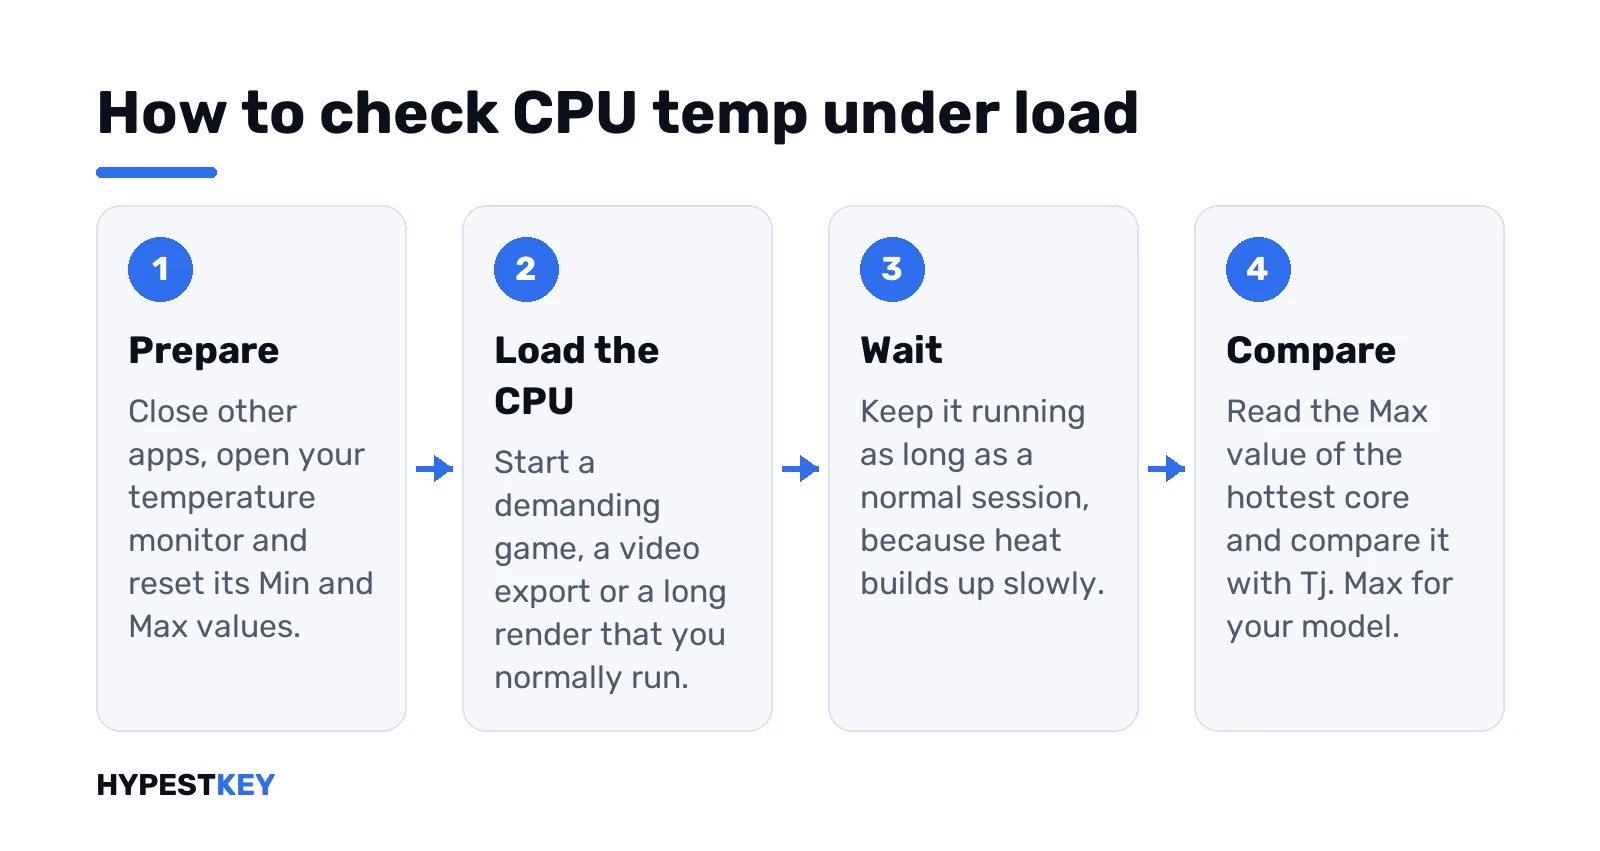
- Close other apps. Open your monitor and reset Min and Max if it offers that.
- Start something heavy that you’d normally run: a demanding game, a video export, a long render.
- Give it as long as a normal session. Short bursts hide slow heat build-up.
- Read Max for the hottest core and compare with Tj. Max.
Your real workload beats a synthetic torture test for this. It shows what the PC does on a normal evening, and nothing gets pushed past what you’d actually ask of it.
Gaming PC? The frame side of the story is on our FPS calculator. Our bottleneck calculator shows whether the CPU or the graphics card holds things back.
CPU temperature and GPU temperature
Two chips, two sensors. People mix them up all the time.
| CPU | GPU | |
|---|---|---|
| Where Windows shows it | Nowhere built in | Task Manager, GPU tab, on some dedicated cards |
| Where the limit is listed | Intel or AMD processor spec page | The graphics card maker’s specs |
| Typical heat source | Compiling, exports, CPU-heavy games | Games at high settings, 3D work |
A game can push either one. HWMonitor shows both in one window, which settles the question of who’s hot. We’d watch both during the same session before buying a new cooler.
Fan speed: the other half of the reading
Temperature alone hides the cause. Fan speed shows it.
HWMonitor lists fan speeds next to the temperatures. Healthy pattern: load goes up, temperature climbs, fan speed follows. Bad pattern: temperature climbs and the fan reading stays flat or shows zero.
Flat fan, rising heat? Check the cable on the board header, then the fan settings in the firmware. Our guide on entering the BIOS gets you there. Names vary by board maker.
A fan that reads zero on a laptop can also mean the sensor isn’t exposed to software. No panic before a second tool agrees.
Keeping an eye on it over time
A single reading? Snapshot. A pattern tells more, and it costs a minute a month.
- Note the idle and the Max values once, on a normal day. That’s your baseline.
- Check again after summer starts. AMD lists ambient temperature among the factors, and a warm room shows up in the numbers.
- Check after any change: new cooler, new paste, a BIOS update, an overclock.
- Check when the PC starts sounding louder than before. Fans react to heat first.
Rising Max values month by month, with the same games and the same room? Dust is our first suspect.
What happens when a CPU overheats
Two safety nets, per Intel. First throttling: the core cuts power and frequency to stay safe, and performance drops. If that’s not enough, the processor shuts down to prevent damage.
AMD describes the same link from its side. At the maximum operating temperature, power and performance are at their limit too.
What you notice: games stutter once they warm up, exports slow down halfway, a sudden power-off under load. Crash loop at startup? Different problem. We’d narrow it down in Windows 11 Safe Mode or Safe Mode on Windows 10.
Lowering a high CPU temperature
AMD’s checklist, in plain order. It applies to Intel desktops just as well.
- Stock settings first. Undo overclocks and custom voltages, update the system.
- Cooler rated for the chip. Its rating should cover the processor’s default power spec.
- Mounted properly, with thermal paste, fans spinning.
- Airflow through the case and the room temperature. Both count.
- Background apps that poll the CPU at idle. Turn off what you don’t need.
Dust in the heatsink fins is the boring classic. Compressed air, PC off and unplugged, fans held still while you blow.
Laptop? Opening it may affect the warranty, and Intel sends laptop owners to the system maker for overheating questions. We’d start with a hard flat surface, clear vents and the maker’s own support page.
Building or upgrading the cooler? Our PSU calculator checks the power side, and the PC price calculator helps with the budget.
Laptops, mini PCs and desktops
Same sensors, different room to breathe. A thin laptop reaches its limit sooner because the cooler is small. Throttling there is normal behaviour, not a fault.
Desktop with a tower cooler under load near the ceiling? Different story. That one’s worth the checklist above.
Prebuilt desktops follow the maker’s own limits for the whole system, as Intel notes for OEM machines. Fan needs replacing? We’d look at that maker’s support page first and order the same part.
Mini PCs land in between. Vents blocked by a monitor stand or a wall make the biggest difference, and we’d give them some open space around the vents.
Other checks while you’re at it
Temperature is one sensor among several. A few quick tests round out the picture.
- Processor on the list for Windows 11 at all. See the Windows 11 hardware requirements.
- Gaming setup tuned? Our notes on Windows 11 for gaming cover the settings.
- Screen keeps up with the frames? The monitor refresh rate test shows the real Hz.
- More free checks sit on our PC tools page.
Rebuilding a cooled-down PC on a fresh install? A Retail Windows 11 Pro key from us arrives instant to email.
FAQ
Does Task Manager show it anywhere?
No. The CPU tab shows load and speed but no temperature. Some graphics cards show a GPU temperature, which is a different chip.
Is 90 degrees bad?
Depends on the model. Ryzen 7 5800XT lists 90°C as its maximum, while many Intel chips list 100°C or more. Check your spec page.
Any way without installing software?
Yes, the BIOS or UEFI setup. It only gives an idle number, though, because the processor is barely working on that screen.
Which free tool should I pick?
Ryzen Master on a Ryzen desktop. Core Temp for a simple per-core view, HWMonitor if you want fans and drives too.
Why is my laptop so hot when idle?
Often a background app keeps the processor busy. Sort Task Manager by CPU, close what you don't need, and keep the vents clear.
Will an overheating CPU get damaged?
Unlikely, according to Intel. The chip throttles first and shuts down if throttling isn't enough, though performance drops on the way.